

👋 Hey, Sahil here - welcome back to Venture Curator, where we explore how top investors think, how real founders build, and the strategies shaping tomorrow’s companies.
Big idea + report of the week :
Why did so many strong YC startups never raise a Series A? Here’s what the data shows.
Enterprise AI spending hit $177 billion. Who’s really getting the money?
Could waiting for a better IPO market cost your startup its chance to go public?
Frameworks & insightful posts :
Is AI creating more software startups or just more software nobody pays for?
Why is $100M in ARR worth $2 billion for one AI startup and $10 billion for another?
This week in Premium:
What does an AI startup landing page that converts look like?
How did emerging AI startups actually get their first customers?
How to get a warm intro to VC without a network? (The ranking system most founders don’t know exists.)
Get access to 150+ premium archive posts, 100+ startup & VC resources, investor databases, fundraising templates, and exclusive startup research - all in one place.
FROM OUR PARTNER - SEMRUSH ONE
Your customers are searching on Google AND ChatGPT. Can they find you on both?
Search has changed. Ranking on Google still matters, but buyers are also asking AI tools which products to use, which companies to trust, and how different options compare.
Semrush One brings both sides into one place. You can track your Google rankings and AI mentions, see the prompts driving demand, compare your visibility against competitors, and find gaps you can actually act on.
It monitors 239M+ relevant LLM prompts globally, alongside the SEO data Semrush is already known for.
START WITH
🧠 Big idea + report of the week
Why did so many strong YC startups never raise a Series A? Here’s what the data shows.
When a seed-stage company fails to raise its Series A, the usual explanation is about the company. The founders weren’t strong enough, the traction wasn’t there, or the batch they came from just wasn’t as good as the ones before it.
But new analysis from Jared Heyman at Rebel Fund suggests that for a whole generation of startups, the answer had very little to do with the founders at all.
Rebel invests in the top 10% of each Y Combinator batch and tracks hundreds of characteristics and outcomes for every YC company and founder in history. Its data showed YC Series A rounds falling off a cliff starting around five years ago, and it set out to find out why.
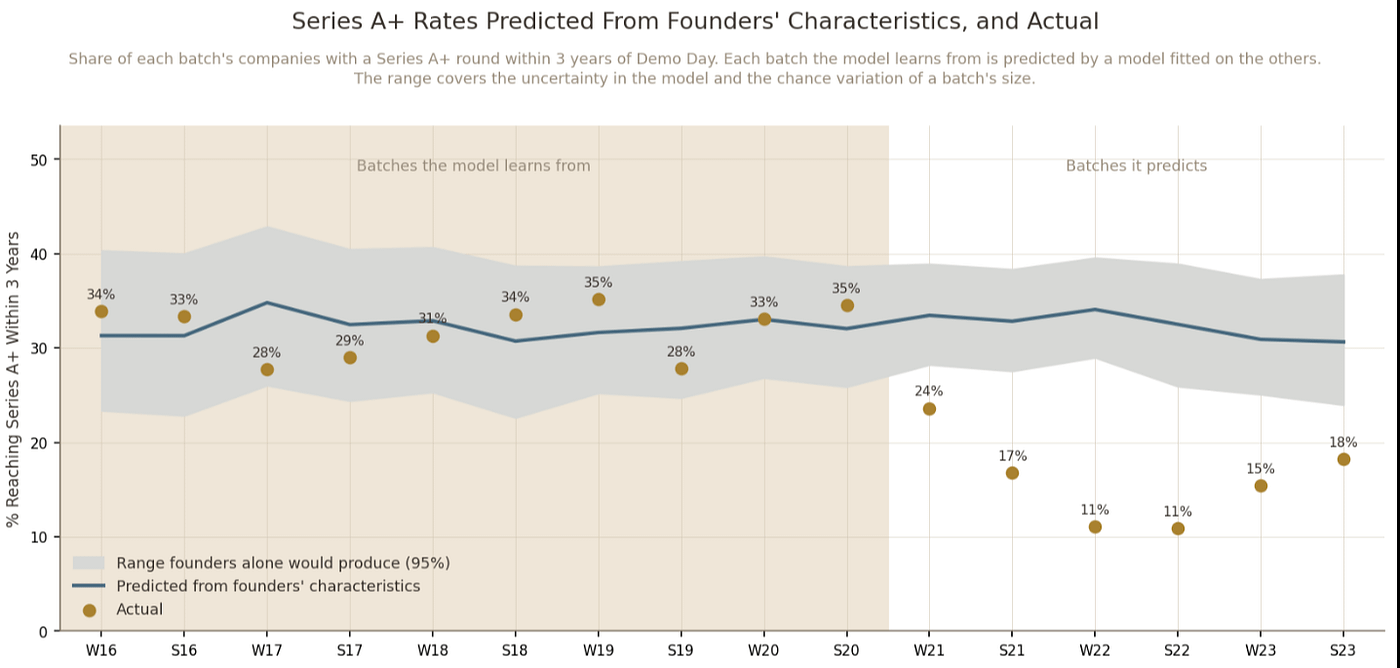
It hit every batch in the same year.
Series A rates dropped for YC companies in 2023 whether they had gone through the program one, two or three-plus years earlier. A weaker 2021 intake can’t explain why a company from 2017 suddenly struggled too.
The founders were just as strong.
Rebel’s model, which scores founders on background, track record, founder-product fit and more, predicted Series A rates accurately until the end of 2020. After that, actual rates fell far below what founder quality predicted.
Quality stopped protecting anyone.
The slowdown hit every tier of founder about equally. A top-quintile team that went through YC in 2022 had worse odds of raising a Series A than a bottom-quintile team from 2018.
The timing lines up with the market, not the founders. Interest rates climbed through 2022 and 2023, late-stage investors stopped writing checks, and Series A investors lost confidence that their companies could raise the next round. It wasn’t just YC either: Carta counted 808 Series A rounds in 2023, roughly half the 1,612 the year before.
So why does this matter now, years after the downturn?
Because the stakes of missing a Series A are high. In Rebel’s data, raising a Series A cuts a company’s odds of shutting down by nearly 3x, and companies that reach Series C or beyond have a 10-year survival rate above 95%. Many of the companies still standing from 2021 onward have teams as strong as any before them. They just knocked when the window was closed.
And this is where founders and investors need to be careful.
A missing Series A has become a weak signal of quality for this generation. Judging a 2021 or 2022 company by whether it “graduated” mostly measures when it tried to raise, not how good it is.
There are early signs of a thaw: in 2025, the share of young YC companies raising a first Series A recovered to 4.2% one year after Demo Day and 7.3% two years after, up from lows of 1.5% and 3.0%. That’s still only about half the pre-2021 norm.
There’s also a bigger open question. Rebel’s newest companies are showing strong revenue growth, capital efficiency and profitability, partly thanks to AI. If they can grow on cash flow alone, some may not need a Series A at all.
The real lesson isn’t that the market was tough. It’s that for a few years, founder quality stopped deciding who got funded, and anyone still using “no Series A” as a shortcut for “weak company” is reading the wrong signal.
Enterprise AI spending hit $177 billion. Who’s really getting the money?
Every enterprise AI plan for 2026 came with a budget. Almost none of them held. Menlo Ventures’ fourth annual State of Enterprise AI report, based on a survey of nearly 400 US enterprise decision-makers controlling more than $4 billion in AI spend, shows how far spending ran past the plan, and where it actually landed.
The headline is scale. Enterprise AI deployment spend hit $177 billion by September 2026, up from $33 billion a year earlier and just $1.7 billion in 2023. That’s 5.4x growth in a single year, faster than the 3.9x the year before.
The more interesting number is the gap between plan and reality:
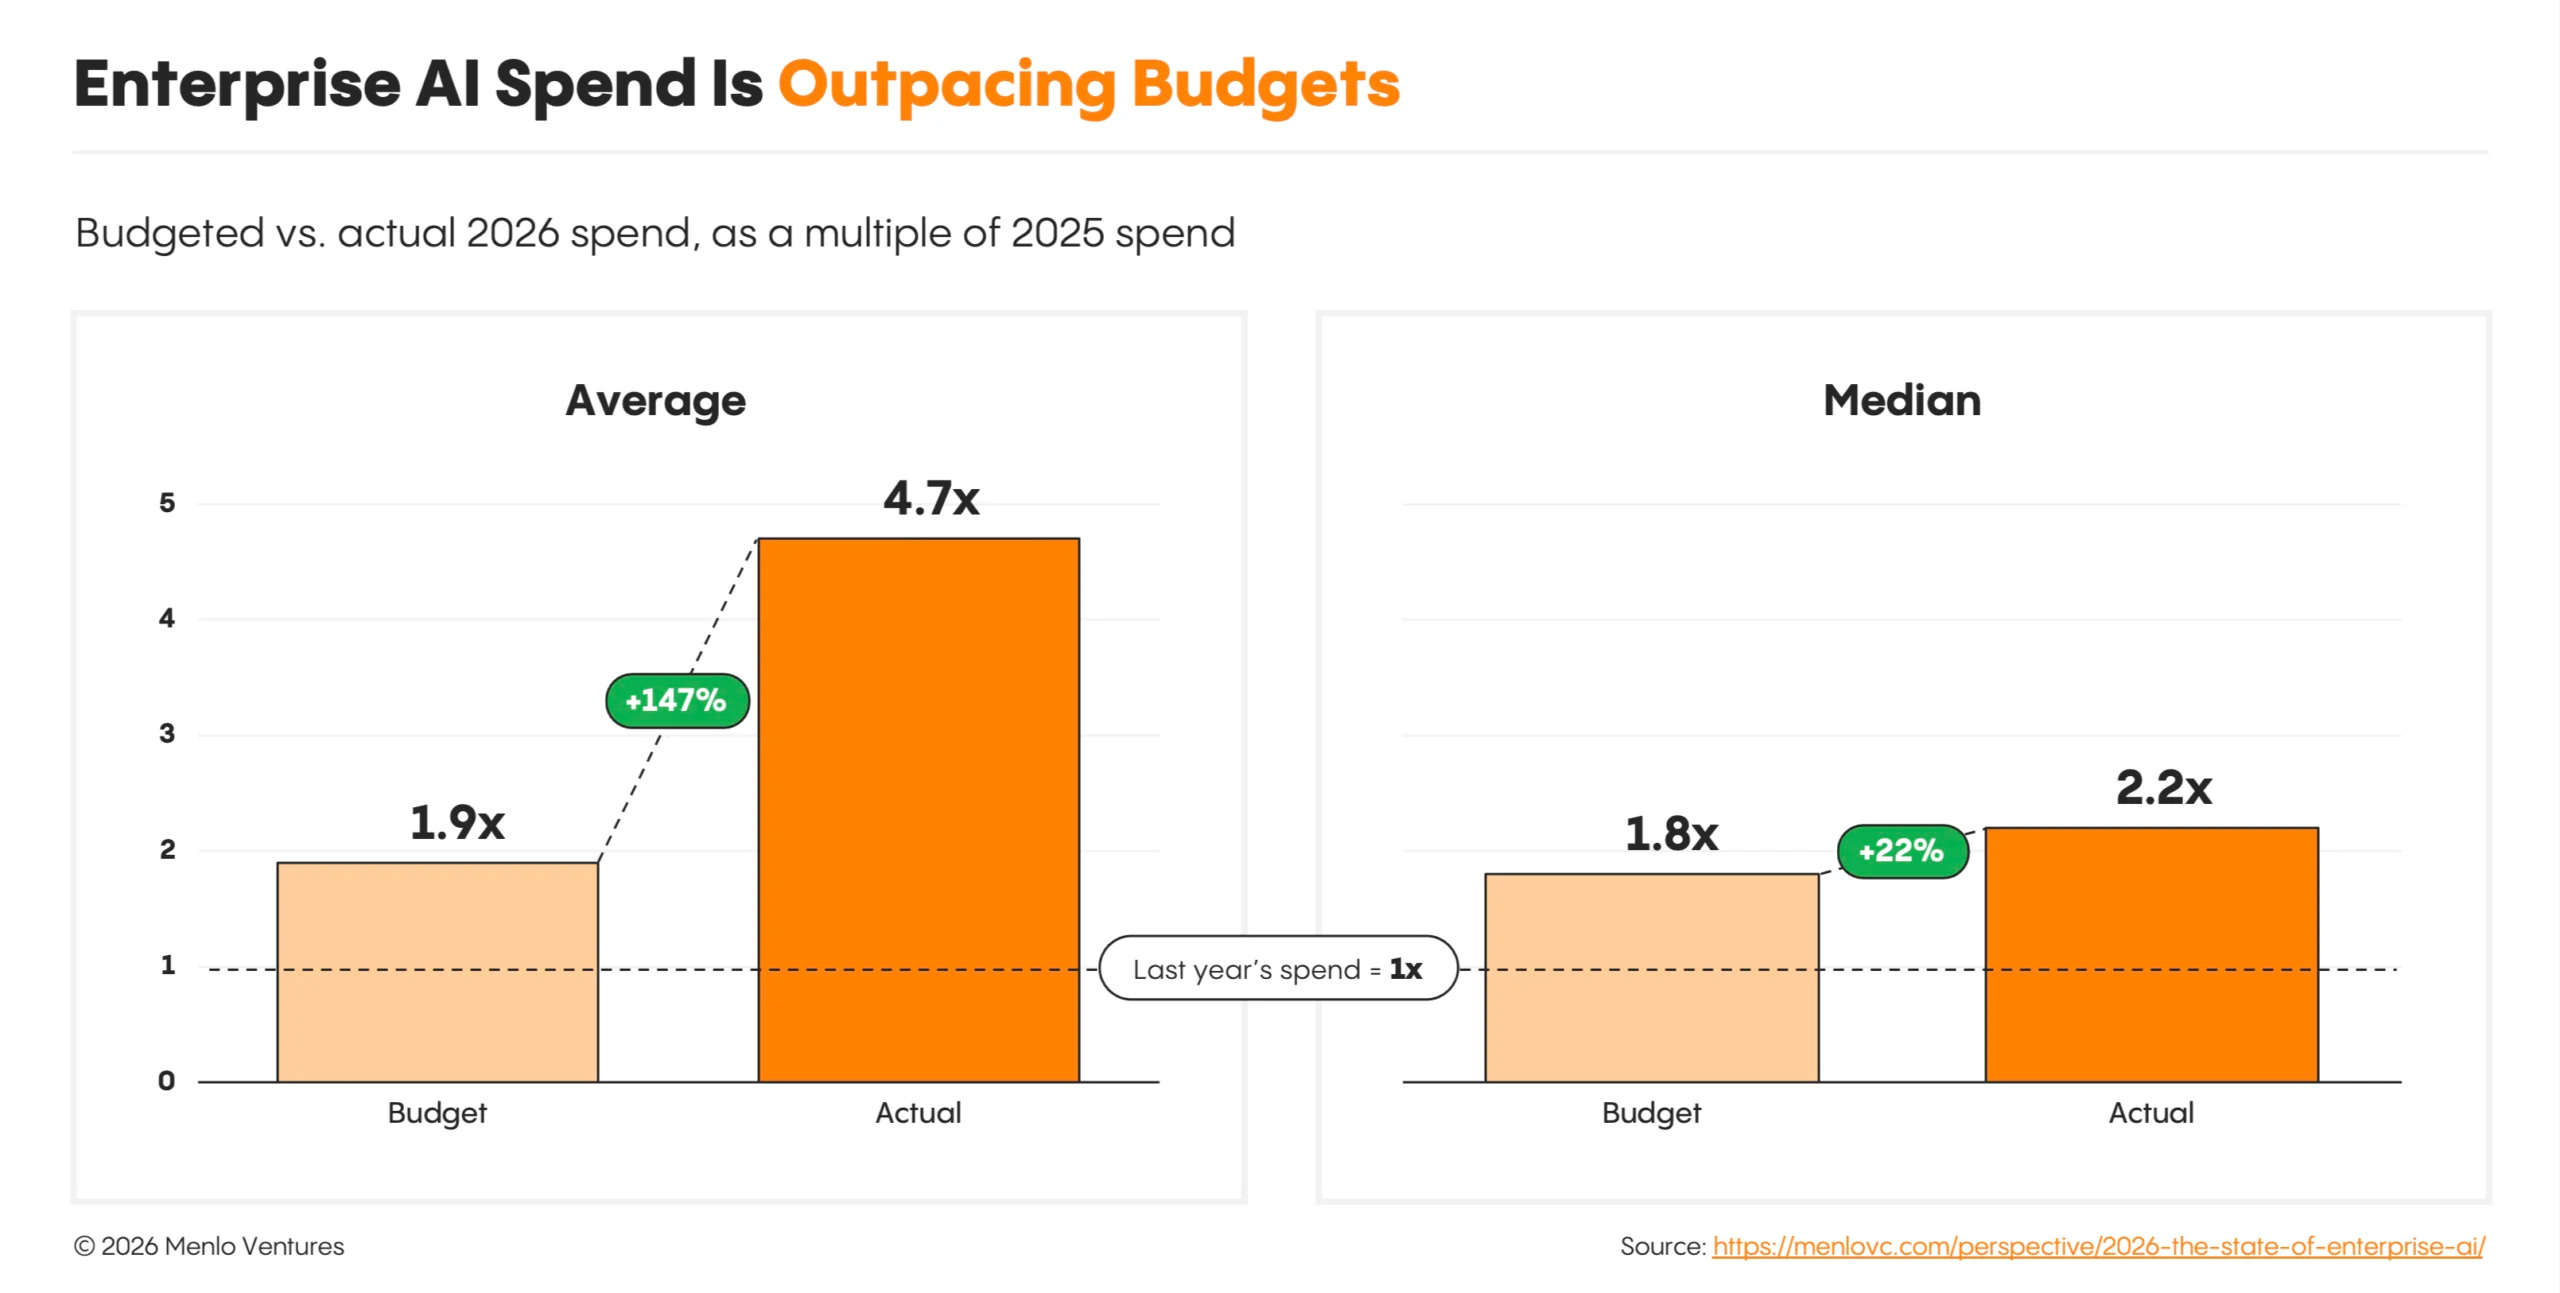
Spend ran at 2.5x the budget.
Enterprises planned to spend 1.9x what they spent in 2025. On average, they spent 4.7x. Even the median company, at 2.2x, overshot its own plan of 1.8x. A small group of power users drives much of the gap.
Adoption barely moved; spend per company exploded.
The share of enterprises using AI only rose from 55% to 65%. Spend per enterprise nearly quintupled. The growth isn’t new buyers. It’s existing buyers going much deeper.
Most of it is new money.
55% of incremental AI dollars came from brand-new budgets, not from existing software or headcount budgets. Only 9% ($12.6 billion) moved from software budgets to AI-native vendors.
That last point runs counter to one of the year's loudest narratives. If AI were rapidly eating SaaS, you’d expect software budgets to be draining into AI vendors. The report finds limited evidence of that, estimating only about a 2-point growth headwind for application SaaS and little sign of core systems like CRM or HRIS being ripped out. Incumbents still lead in IT (91%), data science (88%) and HR (68%).
Where AI-natives are winning, they’re winning almost completely. Coding is now a $34 billion category, up 7.7x, and AI-native vendors hold 96% of it. Coding and chatbots together make up 76% of the $77.3 billion application market. Healthcare is a distant third at $3.7 billion.
The money is also concentrating at the top of the model stack. Anthropic, OpenAI and Google now capture 69% of deployment dollars, up from 50%, and Anthropic and OpenAI alone hold 86% of enterprise LLM API spend.
The frontier models’ share of spend jumped from 35% to 63%. Open-source models are the odd one out: they now run 19% of tokens but take just 4% of the dollars, because buyers keep trading up to frontier models for the work they pay for, even as average token prices fell 3.3x.
Worth knowing: many companies named in the report are Menlo portfolio companies, and the agent usage data comes from OpenRouter, whose users skew toward developers and startups rather than large enterprises.
For founders selling into enterprises, the picture is clear enough to plan around. The budgets are real and growing faster than buyers themselves expected, but they’re mostly new budgets, so you’re competing for a fresh pool of AI money rather than replacing what’s already installed.
And outside coding and chatbots, incumbents still own most categories, which means the opening is in the deeper usage of existing customers, not in assuming the old software stack is about to disappear.
Could waiting for a better IPO market cost your startup its chance to go public?
Founders with an IPO-ready company are usually given the same advice in a tough market: be patient. The window will reopen, valuations will recover, and the companies that wait for the right moment will get the better outcome.
But new research from PitchBook suggests that for many companies, waiting doesn’t lead to a better IPO. It quietly leads to no IPO at all.
PitchBook went back to the start of 2023 and picked out the 254 VC-backed companies its model rated as more likely than not to go public within three years. Then it checked what actually happened to them by the end of 2025.
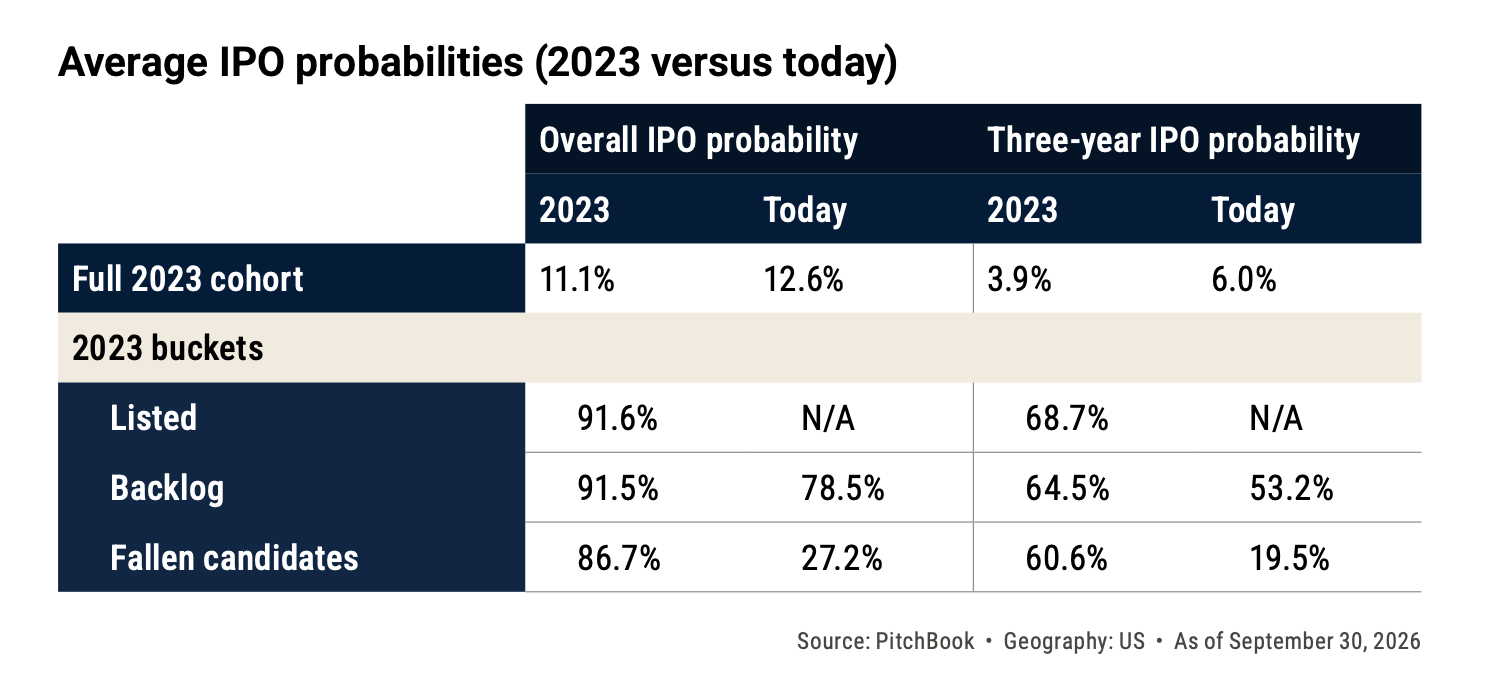
Only 53 of the 254 are actually listed. Another 112 are still private but still look IPO-ready. The remaining 89 have fallen out of contention entirely.
In 2023, all three groups looked almost identical, with IPO odds of roughly 90%. Today, the companies still waiting have slipped to 78.5%, and the ones that fell out have collapsed to 27.2%. The model now expects most of them to be acquired instead.
What separates the groups is time. The companies that listed went public about 11 months after their last funding round. The ones still waiting last raised two years ago. The ones that fell out last raised three and a half years ago.
That timing pattern shows up across the wider market too. Companies that are ready still go public within a year at roughly pre-pandemic rates. But once a company passes that first year without exiting, its chances of exiting within three years are now lower than they used to be. The window doesn’t just close on the market. It closes on the company.
So is waiting the mistake, or just a sign of something else going wrong?
Mostly the second, and the funding data makes that clear. The companies that fell out weren’t just slow. Nearly three in four of their recent rounds were flat or down, and about half hadn’t raised at all since 2023. The ones still waiting look very different: about 73% raised again, their rounds averaged eight times the size of a normal deal, and 61% were up-rounds.
Those companies are holding out by choice, because big private rounds and secondary sales already gave their employees and investors liquidity. The ones that fell out simply ran out of momentum while they waited.
And this is where founders need to be careful.
Waiting only works if you can keep raising at a rising price while you wait. Recent IPOs haven’t made listing look attractive, either: the median VC-backed IPO since 2023 trailed the market by 25.8% in its first 120 days, so the pull to stay private is real. But if your last round is getting old and your next one isn’t lined up, the clock is running against you, not for you. The window you’re waiting for may reopen just after you’ve fallen out of the group that gets to use it.
The real risk isn’t going public in a weak market. It’s treating patience as a strategy when, on this data, the companies that waited without new momentum mostly ended up as acquisition candidates instead.
SOMETHING MORE
🧩 Frameworks & insightful posts
Is AI creating more software startups or just more software nobody pays for?
AI has made software cheap to build, so it’s easy to assume the market is filling up with new competitors. Mack Grenfell went looking for them, and the data tells a more interesting story: there are far more people building software, but hardly any more actual businesses.
The new activity is real. US applications to start a business in the information sector, the closest government category to software, are up 60% since 2024. In the EU, they’re up 37%. The surge started around spring 2025, the same time “vibe coding” took off, and it shows up in the US, the UK and 26 of the 33 European countries Eurostat tracks. Sweden is up 98%, Germany 67%.
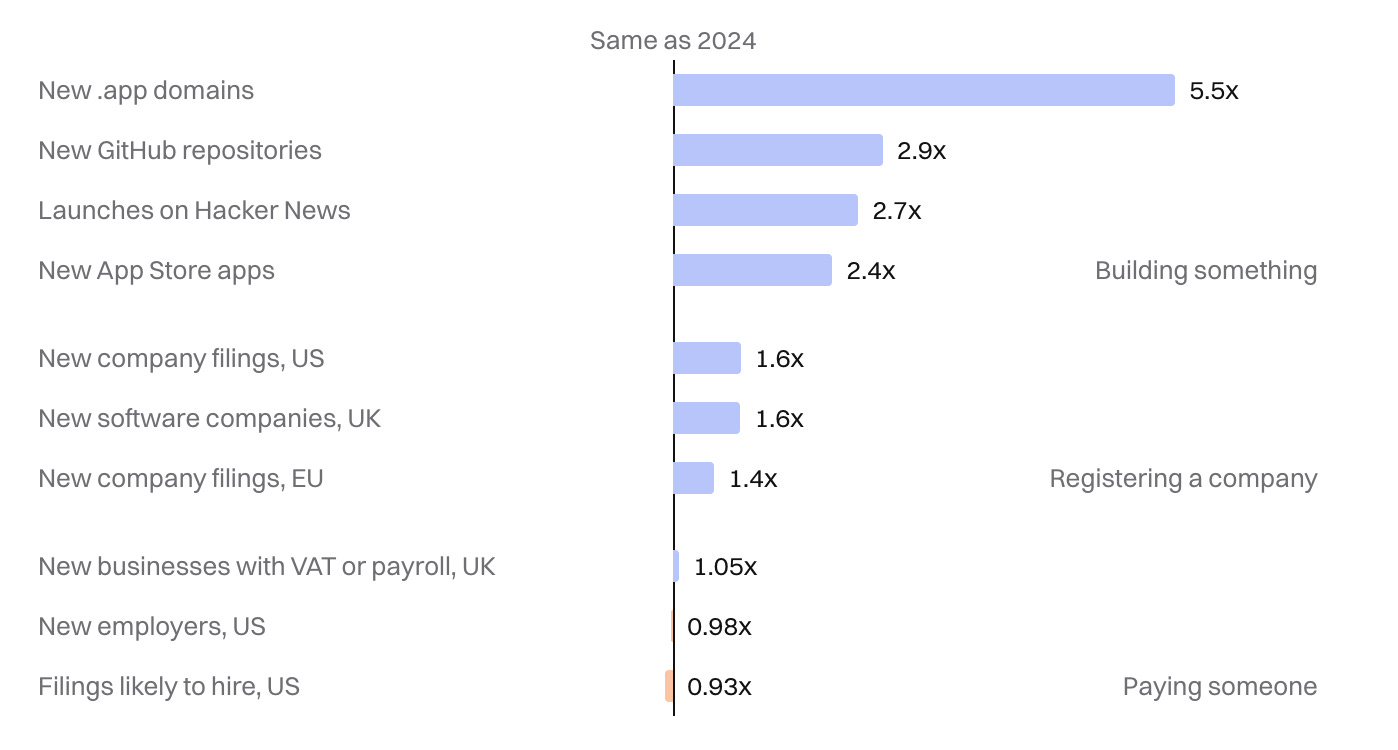
But the further you get from building and the closer you get to running a real business, the flatter the numbers become:
Building something has exploded. New.app domains are up 5.5x since 2024, new GitHub repositories 2.9x, Hacker News launches 2.7x and new App Store apps 2.4x.
Registering a company is up about half. New company filings rose 1.6x in the US and the UK, and 1.4x in the EU.
Paying someone has barely moved. New UK businesses registered for VAT or payroll are up just 1.05x, new US employers are flat at 0.98x, and US filings likely to hire have actually dipped to 0.93x.
This isn’t new either. US business applications have more than tripled since 2005, while the number that go on to hire anyone has barely moved. In the UK last year, 23,645 information businesses closed while only 22,165 opened.
Grenfell’s original guess was that this flood of new products explains why subscription companies are slowing down. At the median company, new revenue from new customers fell by about a fifth in a year.
But the numbers don’t quite add up. To explain that drop by buyers being split across more companies, you’d need about 25% more competitors. The UK, the one place he could count them, grew its register by just 5.5% in a year.
Where the flood does seem to bite is the cheap end of the market. New revenue fell 27% for products costing under $50 a month, 22% for $50 to $100, 16% for $100 to $500 and 13% above $500. New App Store apps roughly doubled in the first half of this year, while downloads grew just 2%. And according to RevenueCat, the typical new subscription app is making about $72 a month after a year.
The explanation is simple: writing the software was never the hard part. Finding people who will pay for it is, and AI hasn’t made that much easier. So there’s been a huge rise in people trying, and very little rise in people getting anywhere.
For founders, where you sit on price matters. If you sell a $20-a-month self-serve product, you probably are competing with the flood for the same attention. If you sell something bigger, the competition looks much more like it did before, and the more useful question is where buyers’ budgets have moved.
Why is $100M in ARR worth $2 billion for one AI startup and $10 billion for another?
Most founders walk into a raise with a valuation in their head borrowed from a friend’s round, a headline, or the old “10x ARR” rule of thumb. That rule has stopped working. In 2026, two companies with the same revenue and similar growth can raise at prices five times apart.
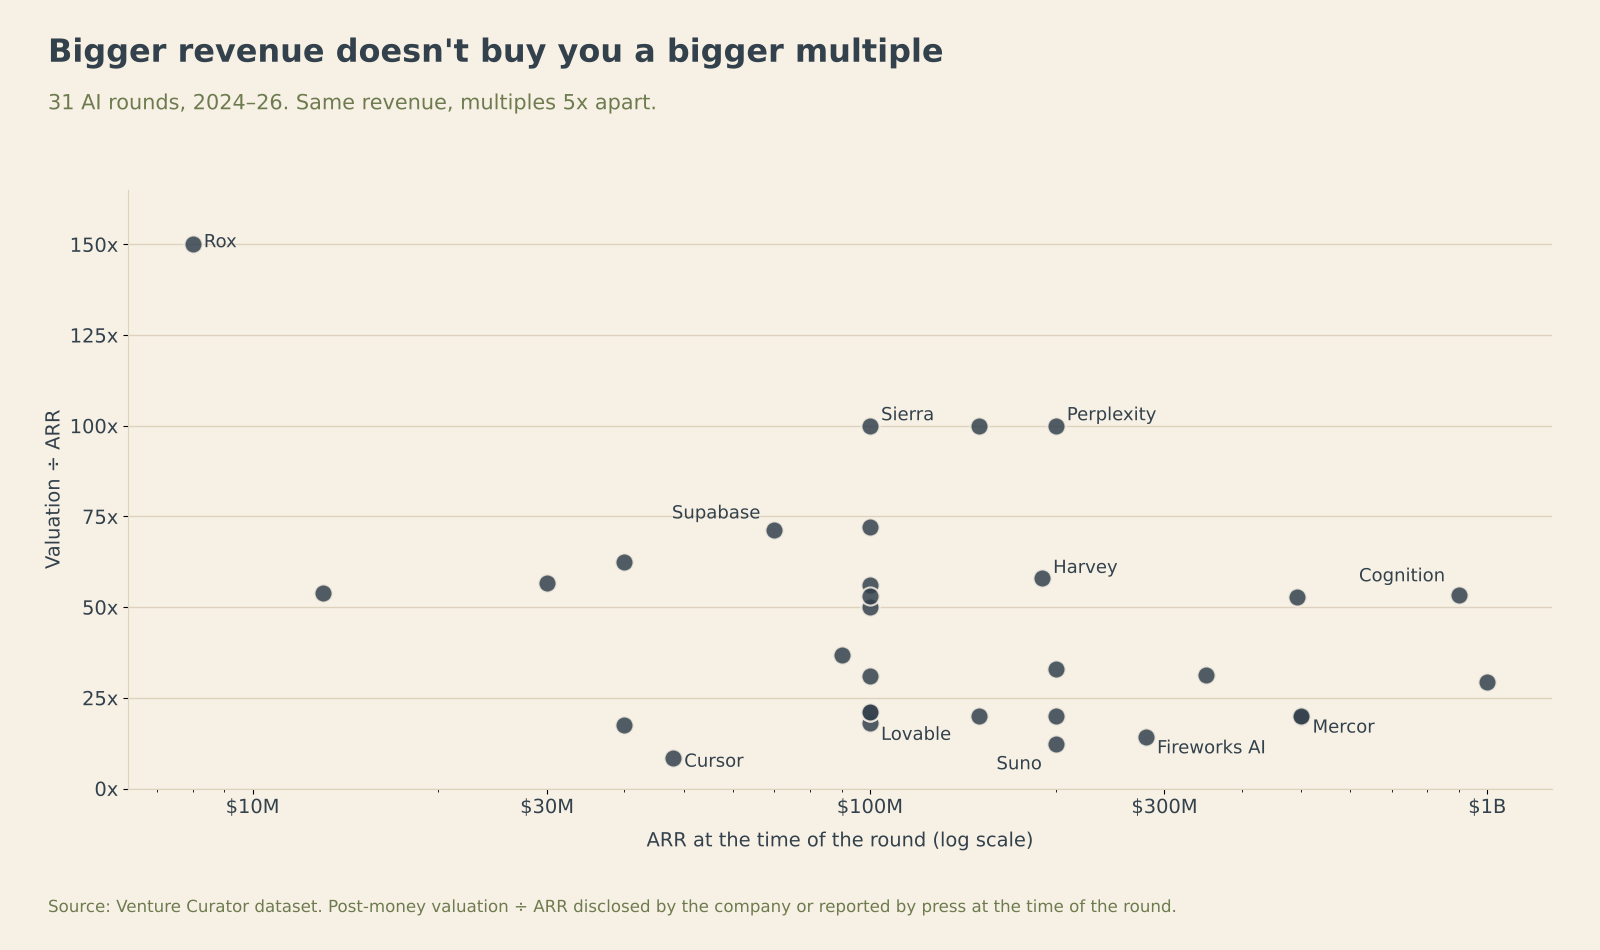
We pulled every AI round from 2024 to 2026 where the company’s ARR at the time was disclosed or credibly reported: 31 rounds across coding, legal, healthcare, voice, infrastructure, sales and consumer apps.
The median company raised at 36.7x ARR, and for rounds priced in 2026 alone, the median jumps to 54.6x. Public software, by comparison, trades at a median of about 3.2x.
Bigger revenue doesn’t buy a bigger multiple. Look at the companies that raised at almost exactly $100M in ARR: Lovable priced at about 18x, Gamma at 21x, Clay at about 31x, Harvey at 50x, Legora at 56x, Glean at about 72x and Sierra at 100x.
That’s a 5.5x spread at the same revenue, and growth doesn’t explain it either. Lovable was arguably the fastest grower on the list and priced near the bottom.
What does explain it is how a company earns its revenue:
Enterprise contracts that replace a team, a role or a budget line raised at a median of 54x ARR.
Usage or API revenue raised at a median of 47x, with a wide range depending on margin.
Self-serve subscriptions bought on a credit card raised at a median of 20x.
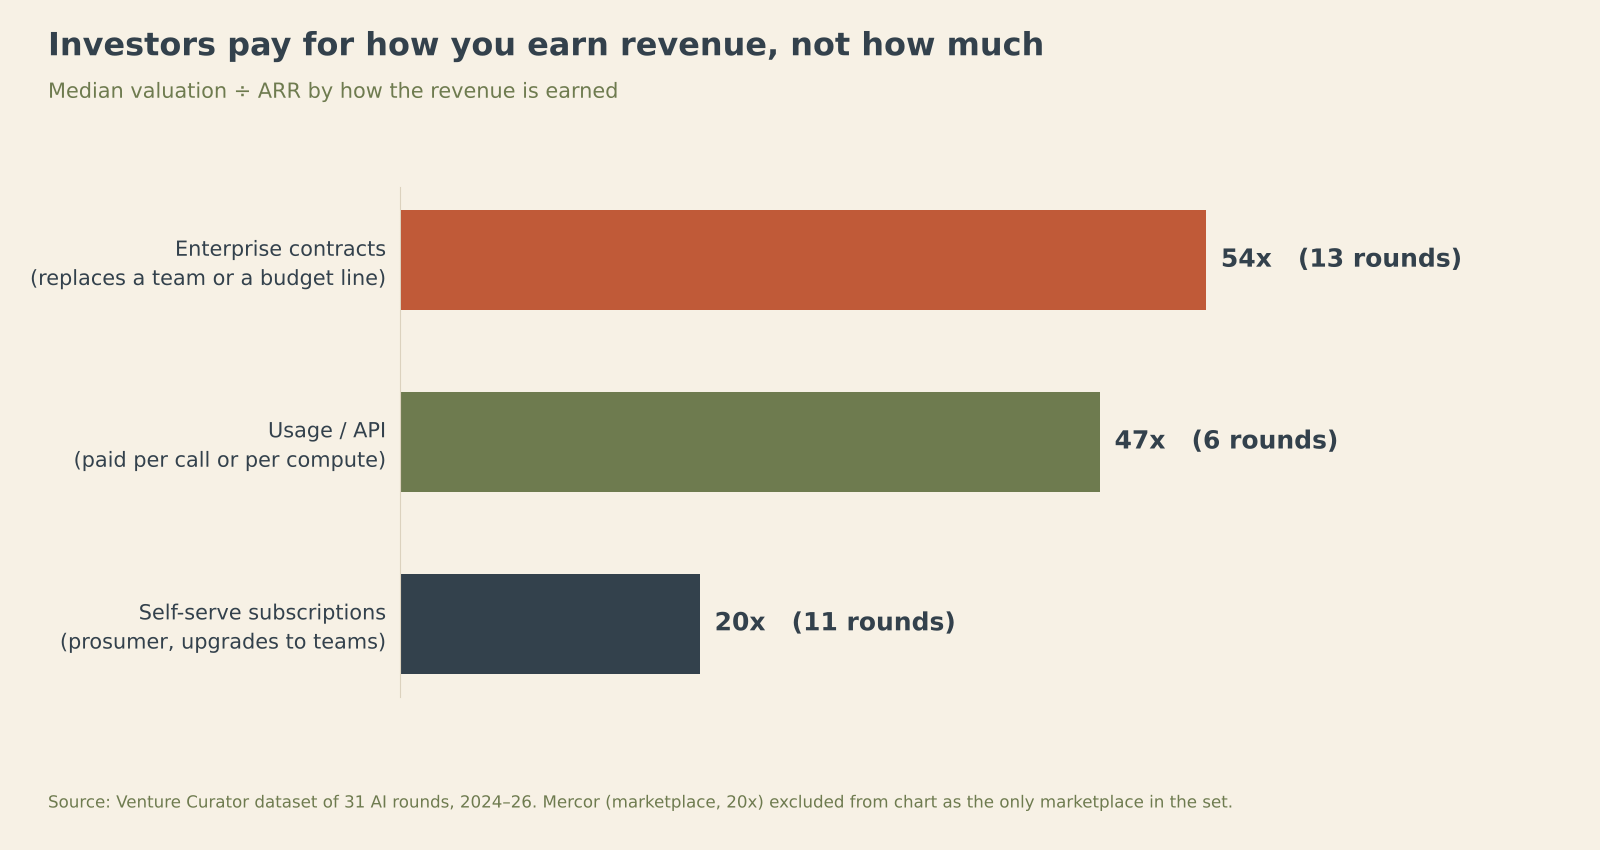
Same dollar of ARR, roughly 2.7x the price depending on where it comes from. Enterprise revenue is a claim on a labour budget, which is a much bigger pool than a software budget. Self-serve revenue is a bet on retention that hasn’t been proven yet, and it can disappear in thirty days.
Cursor is the clearest proof: it raised its Series A at about 8x when it was mostly individual developers paying monthly, and by late 2025 it was raising at 29x after shifting most of its revenue to enterprise contracts. Same product, different way of earning, different multiple.
There’s also a catch in the headline numbers. In a growing number of hot AI rounds, the lead investor buys in at a lower price while others pay much more, and the company announces the higher figure. Raise $60M at $600M and $40M at $1.2B, and you’ve really raised at $750M, not the $1.2B in the press release. That headline then becomes the bar your next round has to beat.
We broke down the six moves that get you priced in the higher bracket, plus a valuation calculator and an eight-question positioning score you can run on your own numbers, in What is your startup actually worth in 2026?
PREMIUM WRITEUPS
📄 This week's premium write-up


📬 Upgrade to Venture Curator Premium
Get access to 150+ premium archive posts, 100+ startup & VC resources, investor databases, fundraising templates, and exclusive startup research - all in one place.
TODAY’S JOB OPPORTUNITIES
💼 Venture capital & startup jobs
Partner 18, Talent - a16z | USA - Apply Here
Senior Investment Manager - AMEX Venture | USA - Apply Here
Portfolio Management – Citi Ventures | USA - Apply Here
Partner 22, New York Events Space Lead - a16z | USA - Apply Here
Ventures Associate - Plug and Play Tech Centre | USA - Apply Here
Head of Investor Relations - VIDA Vision Fund | USA - Apply Here
Origination Associate - Flagship | USA - Apply Here
Analyst/Associate - Diagram | Canada - Apply Here
Intern - Investment Management - Yournest | India - Apply Here
Investment Manager - Blue Ashva Capital | India - Apply Here
Check out 31+ VC job opportunities in “BREAK INTO VC” newsletter.
Partnership With Us
Get your product in front of an audience of 125,000+ - Our newsletter is read by thousands of tech professionals, founders, investors and managers worldwide. Get in touch today.
Upgrade to Venture Curator Premium
Get access to 150+ premium archive posts, 100+ startup & VC resources, investor databases, fundraising templates, and exclusive startup research - all in one place.
(Subscribe to Venture Curator Premium and get 20% off forever.)